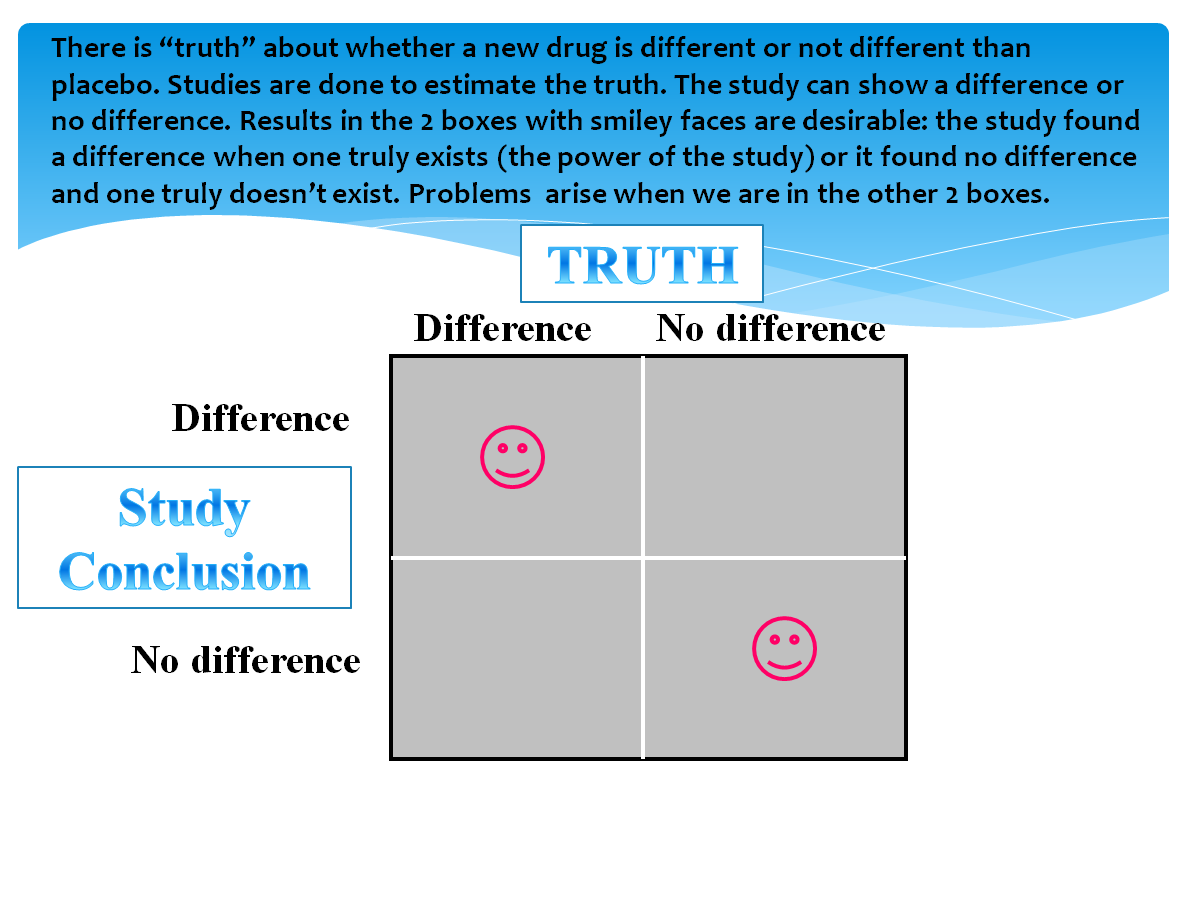
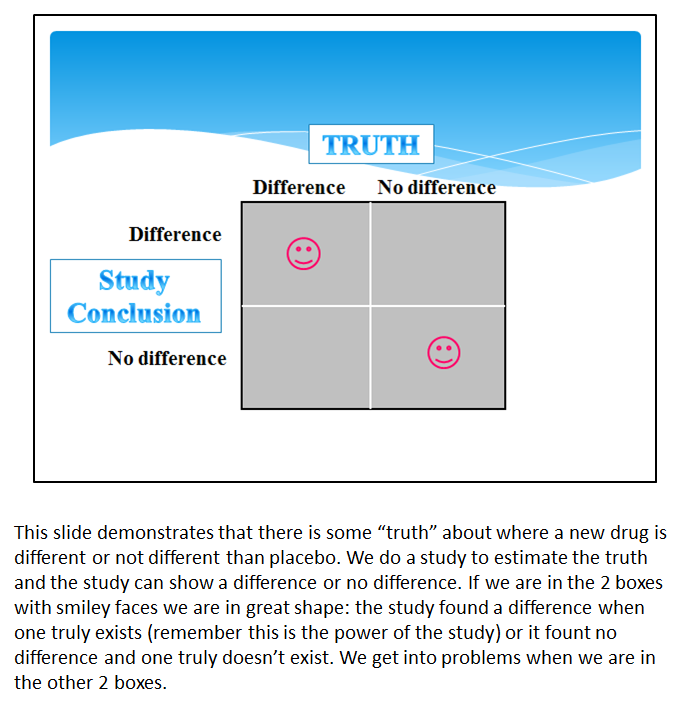
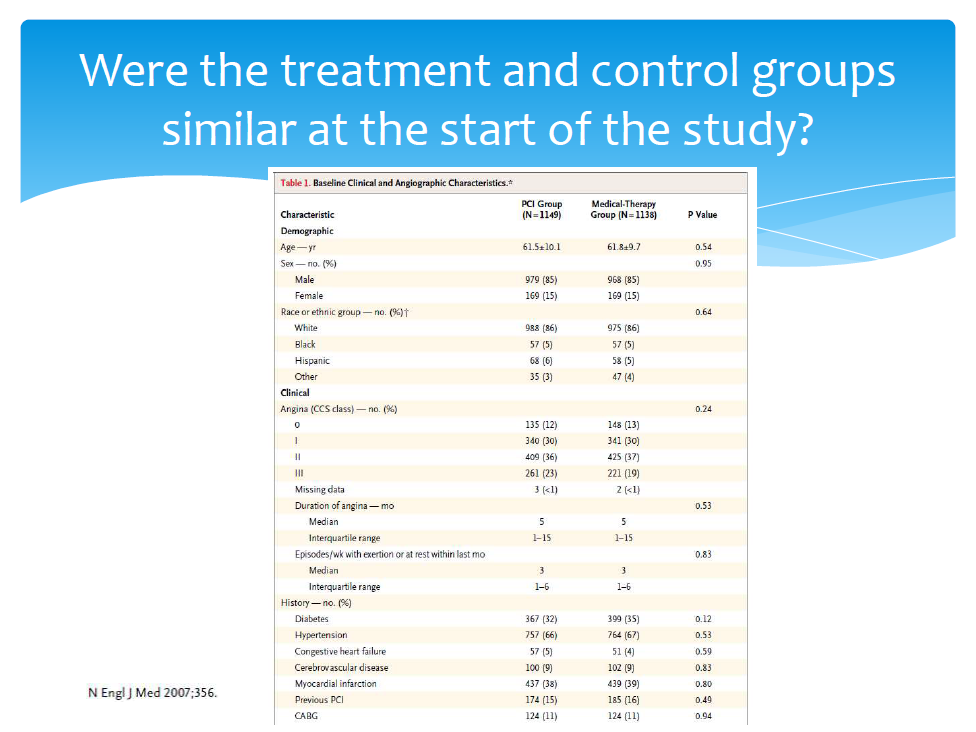
The following is a slide I might use to teach about one of the criteria for critically appraising a therapy study. What do you think about it? Will students learn deeply from it?

Version 1
The multimedia principle states that people learn more deeply from words and pictures than from words alone. Why might this be? Reflect upon the cognitive theory of multimedia learning and think about why the multimedia principle leads to better learning.
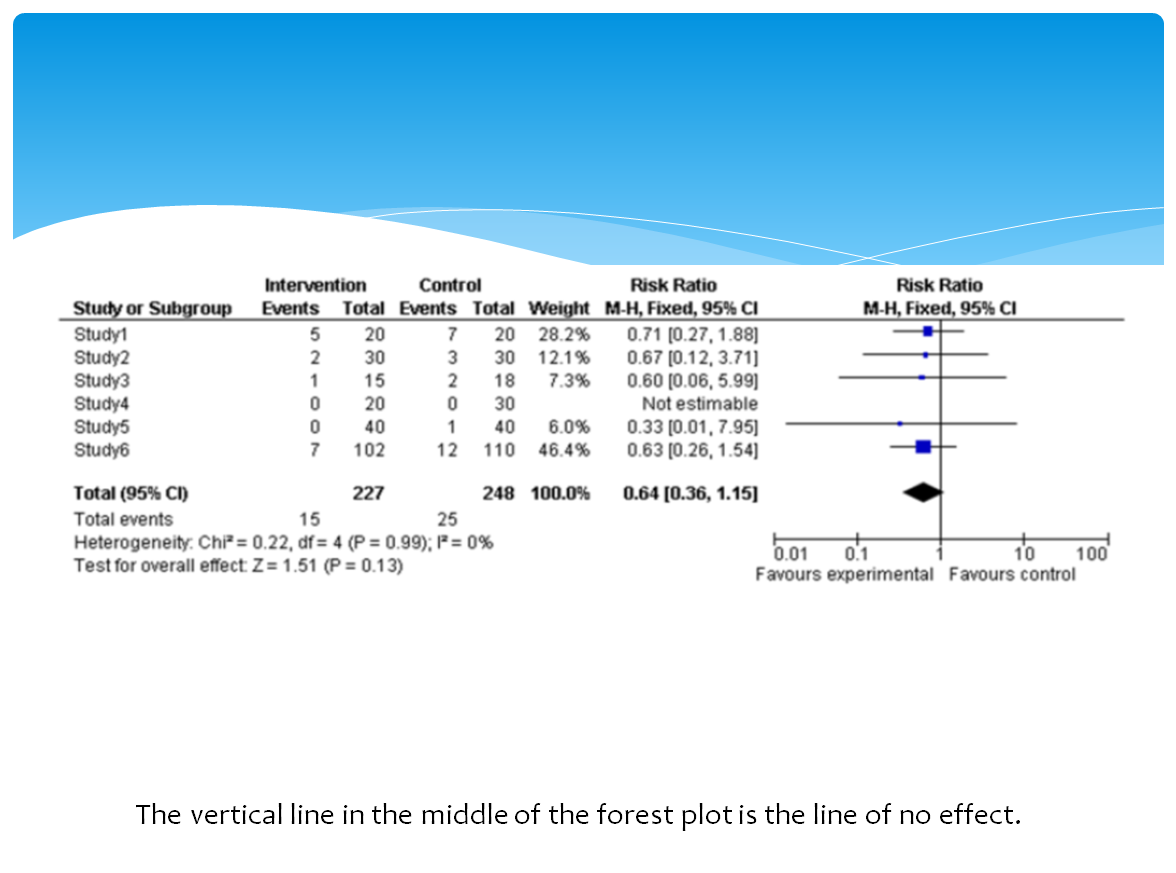
Here is another version of the previous slide that better adheres to the multimedia principle. (Note: Would you like to enlarge the image? If so, please click on it). What do you think about this one? Will students learn more deeply from it or version 1?

Version 2
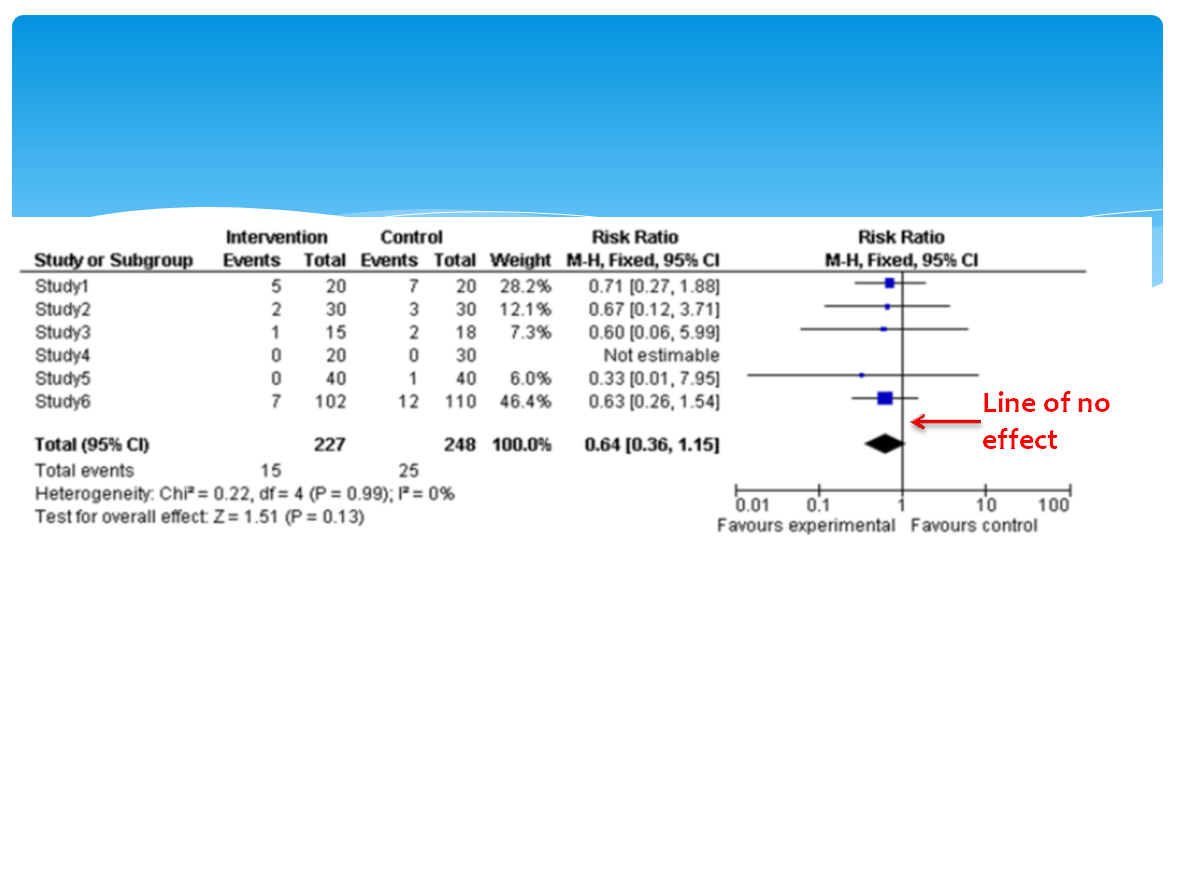
Where are the words you say? They would be spoken during a lecture explaining the same information on the version 1 slide. They just aren’t typed out on the slide. Another format would be to put the written words in the notes area in PowerPoint.
Research would predict that students will learn more deeply from version 2 than version 1. Why? Remember active processing occurs where we take words and images and develop verbal and pictorial models. The words and images work together to help learners develop the models. Words alone can lead to more cognitive work for the learner to construct a model. Also, words alone might not be effective in activating prior knowledge which we need to do so that it can be integrated with our new model which then leads to learning. I have left out an important explanation here (can you guess what it is?) but it is a multimedia principle of its own and will be covered in an upcoming post.
Are all images created equal? What kind of images should I use? The answer to both of these question is that it depends. Lets focus on what you are trying to teach first. If you are trying to teach a motor skill or complicated manual tasks animated images or video seems to work better. Static images are better or just as effective as animation for everything else. Static images seem to be better for promoting deep understanding.
Which graphic below do you think would lead to better understanding about heart function? A or B?
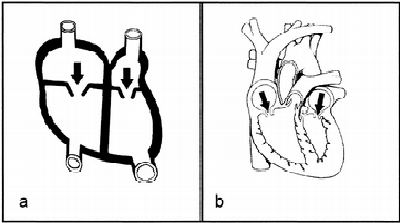
From Butcher. J of Educ Psychol 2006;98:182
Butcher (2006) found that simpler visuals (a) led to better understanding. The simpler visual led learners to make more attempts to understand how the heart works than the complex visual. Making more attempts led to better mental models. It seems that too complex of images can overwhelm novice learners.
Some caveats or limitations of this principle:
- If learners can control the pace of instruction complex images promoted stronger knowledge gains (in a lecture setting where the instructor controls the pace simple images are better)
- Its more important for novice learners
- Sometimes only words can be used to explain a topic
What’s the evidence for this? Mayer, in Table 7.1 in the Cambridge Handbook of Multimedia Learning (2014), summarizes 9 studies published through 2006 and finds an average effect size on retention tests of 0.19 and for transfer tests of 1.63 (effect sizes > 0.8 are significant, 0.5 are moderate). Thus, this principle shows weaker effects for retention but good effects on deeper understanding.