The following is a slide I might use to begin teaching about p-values, type I and type 2 errors. What do you think about it? Will students learn deeply from it? (Would like to see a larger version of the slide? Please click on it)
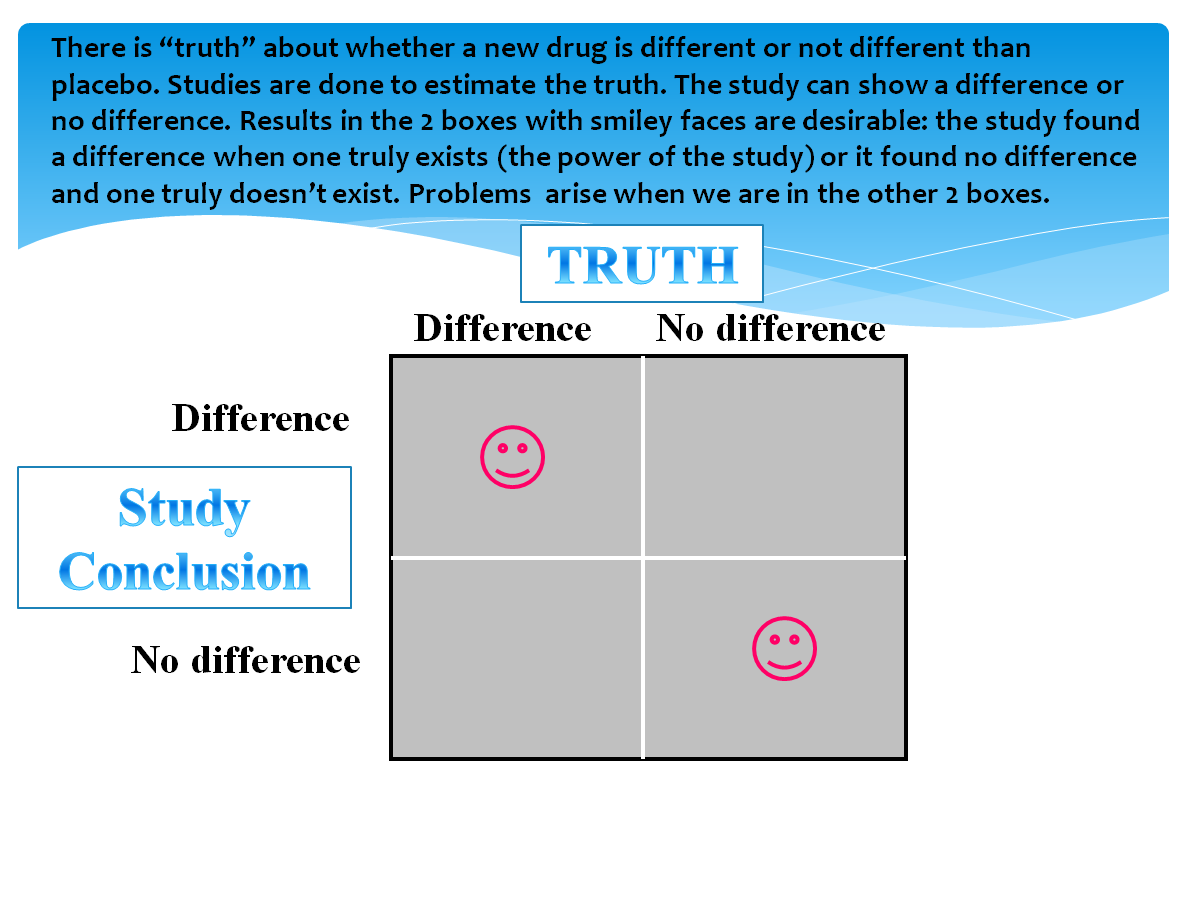
Version 1
Or do you think students would learn more deeply from this slide? The words at the bottom of the slide would be spoken by the instructor while the graphic is displayed.
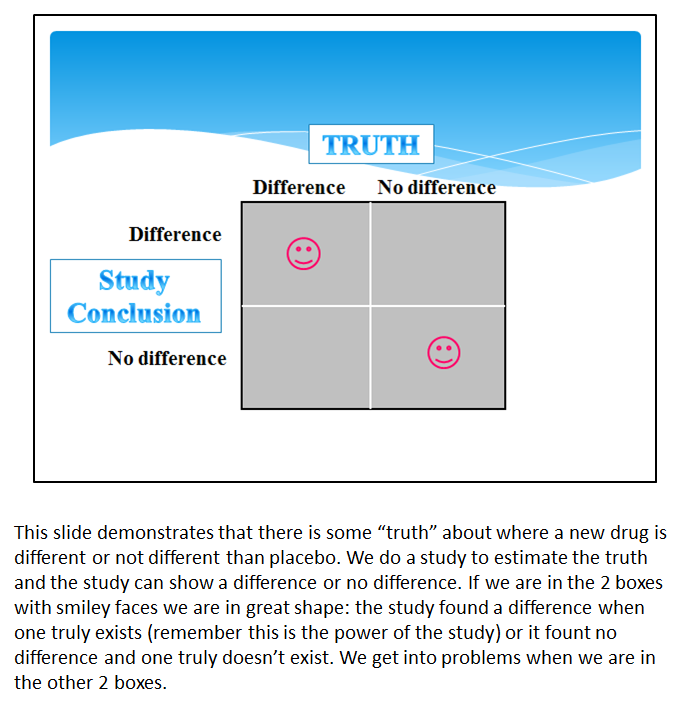
Version 2
Research would predict version 2 is better and will lead to deeper understanding. But why? What is different about them?
Version 1 violates the modality principle which states that people learn more deeply from multimedia lessons when words explaining concurrent graphics are presented as speech rather than as on-screen text. In version 1, the visual channel would have to simultaneously process the graphic and the printed text. This would likely overload this channel. In contrast, in version 2 the education message is split across separate cognitive channels- the graphic in the visual channel and words in the auditory channel.
Some caveats or limitations of this principle:
- It’s more important for novice learners
- It’s more important if the material is complex and presented at a rapid pace in a lecture. If the learner can control the pace of the material the modality principle is less important.
- Doesn’t apply if only printed words are presented on the screen (without any corresponding graphic)
- There are times when words should be presented on screen
- words are technical
- words are not in the learner’s native language
- words are needed for future reference (e.g. directions to a practice exercise)
What’s the evidence for this? The modality principle is supported by more research than any other multimedia principle. Mayer identified 21 studies published through 2004 and found an average effect size on transfer tests of 0.97 (effect sizes > 0.8 are significant, 0.5 are moderate).

