In noon conference today I reviewed the good, the bad, and the ugly of the recently released ACC/AHA cholesterol treatment guidelines. Below is a YouTube video review of the guidelines. It will be interesting to see how cholesterol management evolves over the next few years. There are groups like the National Lipid Association who feel that removing the LDL goals from the new guideline was a mistake. Likewise, the European Society of Cardiology lipid guidelines recommend titrating statins to LDL targets. Conflicting guidelines are always a problem. I will address conflicting guidelines in my next post and what to think about when you see conflicting recommendations on seemingly the same topic.
Tag Archives: statins
I Am Not Using The New Risk Predictor In The Recently Released Cholesterol Guidelines
Last week the hotly anticipated cholesterol treatment guidelines were released and are an improvement over the previous ATPIII guidelines. The new guidelines abandon LDL targets, focus on statins and not add-on therapies which don’t help, and emphasize stroke prevention in addition to heart disease prevention.
The problem with the new guidelines is that they developed a new risk prediction tool which frankly stinks. And the developers knew it stunk but promoted it anyway!
Lets take a step back and discuss clinical prediction rules (CPR). CPRs are mathematical models that quantify the individual contributions of elements of the history, PE, and basic laboratory tests into a score that aids diagnosis or prognosis estimation. They can accommodate more factors than the human brain can take into account and they always give the same result whereas human judgment is inconsistent (especially in the less clinically experienced). To develop a CPR you 1) construct a list of potential predictors of the outcome of interest, 2)examine a group of patients for the presence of the candidate predictors and their status on the outcome of interest, 3) determine statistically which predictors are powerfully and significantly associated with the outcome, and 4) validate the rule [ideally involves application of rule prospectively in a new population (with different spectrum of disease) by a variety of clinicians in a variety of institutions].
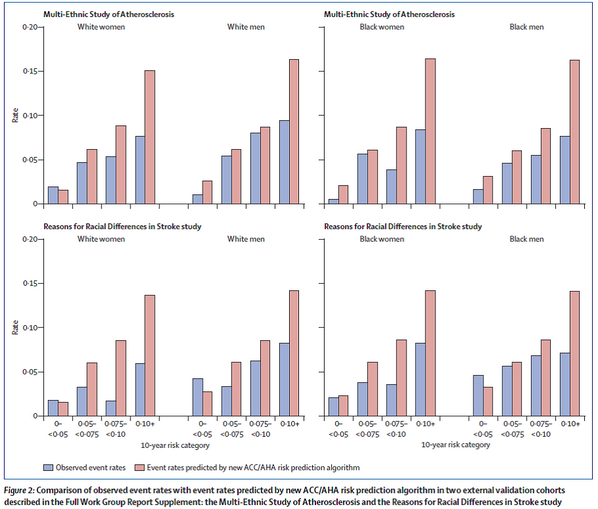
Back to the new risk tool. They decided to develop a new tool because the Framingham Score (previously used in the ATPIII guidelines) was insufficient (developed on exclusively white population). How was it developed? The tool was developed using “community-based cohorts of adults, with adjudicated endpoints for CHD death, nonfatal myocardial infarction, and fatal or nonfatal stroke. Cohorts that included African-American or White participants with at least 12 years of follow-up were included. Data from other race/ethnic groups were insufficient, precluding their inclusion in the final analyses”. The data they used was from “several large, racially and geographically diverse, modern NHLBI-sponsored cohort studies, including the ARIC study, Cardiovascular Health Study, and the CARDIA study, combined with applicable data from the Framingham Original and Offspring Study cohorts”. I think these were reasonable derivation cohorts to use. How did they validate the tool? Importantly they must use external testing because most models work in the cohort from which it was derived. They used “external cohorts consisting of Whites and African Americans from the Multi-Ethnic Study of Atherosclerosis (MESA) and the REasons for Geographic And Racial Differences in Stroke study (REGARDS). The MESA and REGARDS studies were approached for external validation due to their large size, contemporary nature, and comparability of end points. Both studies have less than 10 years of follow up. Validation using “most contemporary cohort” data also was conducted using ARIC visit 4, Framingham original cohort (cycle 22 or 23), and Framingham offspring cohort (cycles 5 or 6) data”. The results of their validity testing showed C statistics ranging from a low of 0.5564 (African -American men) to a high of 0.8182 (African-American women). The C statistic is a measure of discrimination (differentiating those with the outcome of interest from those without the outcome) and ranges from 0.5 (no discrimination- essentially as good as a coin flip) to 1.0 (perfect discrimination). The authors also found that it overpredicted events. See graph below.
So why don’t I want to use the new prediction tool? 3 main reasons:
1) It clearly over predicts outcomes. This would lead to more people being prescribed statins than likely need to be on statins (if you only use the tool to make this decision). One could argue that’s a good thing as statins are fairly low risk and lots of people die from heart disease so overtreating might be the way to err.
2) No study of statins used any prediction rules to enroll patients. They were enrolled based on LDL levels or comorbid diseases. Thus I don’t even need the rule to decide on whether or not to initiate a statin.
3) Its discrimination is not good….see the C-statistic results. For Black men its no better than a coin flip.
