I’m Still Not Crazy About the Pooled Risk Equations in the New Cholesterol Guidelines

2 papers got published this week to further validate the pooled risk equations developed for the ACC/AHA Cholesterol Guidelines.
Muntner and colleagues used the REGARDS participants to assess the calibration and discrimination of the pooled risk equations. This study had potential as it oversampled patients from the stroke belt. This is important because the Pooled Risk Equations were developed  to overcome the limitations of the Framingham tool (mainly its lack of minorities).  I have a real problem with this study because the pooled risk equations estimate 10 yr risk of CHD and stroke and this study only has 5 yrs of follow-up for the REGARDS participants. I don’t think their estimates of calibration and discrimination are valid. Risk of CHD and stroke should increase over time so event rates could change with 5 more years of follow-up. The important thing this paper adds is the reminder that observational studies often lack active surveillance. Most observational studies rely on self report of outcomes and obviously silent events would be missed by the patient as would events for which the patient didn’t seek evaluation. Muntner and colleagues also used Medicare claims data to identify events not detected through routine cohort follow-up and found 24% more events. This is a useful lesson from this study.

In a more useful study Kavousi and colleagues compared 3 risk prediction tools (pooled risk equations, Framingham, and SCORE)  using the Rotterdam Study, a prospective population-based cohort of persons aged 55 yrs and older. This cohort does have 10 yrs of follow-up.

overprediction

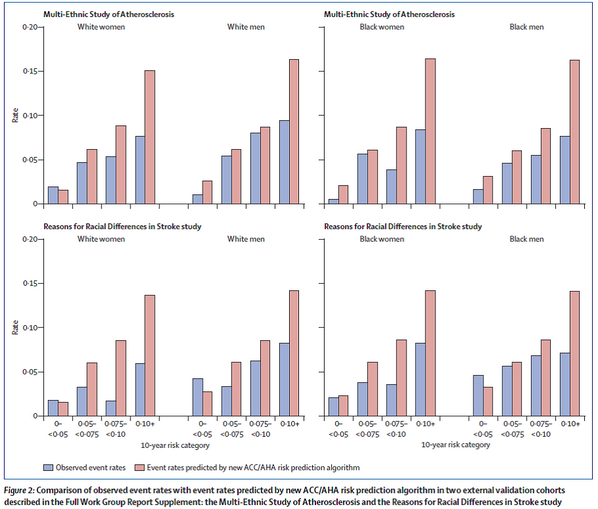
This figure shows that at each level of risk the pooled risk equations overestimated risk, though less so in women.

treatment rec

This figure shows the proportion of patients for whom treatment is recommended (red bars), treatment should be considered (yellow bars), and no treatment is recommended (green bars). As you can see the new risk tool leads to the large majority of men “needing treatment” compared to previous guidelines (ATP III) and the current European guidelines (ESC).

calibration curves

Finally, this figure shows the calibration curves and the calibration was not good. The blue dots should lie right upon the red line for good calibration. Furthermore, the c-statistic is 0.67 (a measure of discrimination which means the tool can differentiate diseased from nondiseased patients. A c-statitic above 0.7 is considered moderate to good. The closer to 1 the better).

Why might the pooled risk equations overestimate risk? Maybe they don’t if you believe the Muntner study. It could just be a problem with the lack of active surveillance in the cohort studies used to validate the tool. Or they really do overestimate risk because they aren’t accurate or maybe more contemporary patients receive better therapies that improve overall health or maybe the baseline risk characteristics of the validation cohorts just differ too much from the development cohorts.

I am still not sold on the new pooled risk equations but they might not be much better than what we have been using based on the Kavousi study (Framinham also overpredicted risk and had poor calibration). I think we need more study and tweaking of the tool or we use the tool as is and focus more on cardiovascular risk reduction (with exercise, diet, tobacco cessation, diabetes and HTN control) and don’t focus so much on starting a statin right away.

The Mayo Clinic has a nice patient decision aid that you can use to help patients decide if a statin is right for them: http://statindecisionaid.mayoclinic.org/index.php/site/index


Review of the 2013 ACC/AHA Cholesterol Treatment Guidelines

In noon conference today I reviewed the good, the bad, and the ugly of the recently released ACC/AHA cholesterol treatment guidelines. Below is a  YouTube video review of the guidelines. It will be interesting to see how cholesterol management evolves over the next few years. There are groups like the National Lipid Association who feel that removing the LDL goals from the new guideline was a mistake. Likewise, the European Society of Cardiology lipid guidelines recommend titrating statins to LDL targets.  Conflicting guidelines are always a problem. I will address conflicting guidelines in my next post and what to think about when you see conflicting recommendations on seemingly the same topic.

I Am Not Using The New Risk Predictor In The Recently Released Cholesterol Guidelines

Last week the hotly anticipated cholesterol treatment guidelines were released and are an improvement over the previous ATPIII guidelines. The new guidelines abandon LDL targets, focus on statins and not add-on therapies which don’t help, and emphasize stroke prevention in addition to heart disease prevention.

The problem with the new guidelines is that they developed a new risk prediction tool  which frankly stinks. And the developers knew it stunk but promoted it anyway!

Lets take a step back and discuss clinical prediction rules (CPR). CPRs are mathematical models that quantify the individual contributions of elements of the history, PE, and basic laboratory tests into a score that aids diagnosis or prognosis estimation. They can accommodate more factors than the human brain can take into account and they always give the same result whereas human judgment is inconsistent (especially in the less clinically experienced). To develop a CPR you 1) construct a list of potential predictors of the outcome of interest, 2)examine a group of patients for the presence of the candidate predictors and their status on the outcome of interest, 3) determine statistically which predictors are powerfully and significantly associated with the outcome, and 4) validate the rule [ideally involves application of rule prospectively in a new population (with different spectrum of disease) by a variety of clinicians in a variety of institutions].

Back to the new risk tool. They decided to develop a new tool because the Framingham Score (previously used in the ATPIII guidelines) was insufficient (developed on exclusively white population). How was it developed? The tool was developed using “community-based cohorts of adults, with adjudicated endpoints for CHD death, nonfatal myocardial infarction, and fatal or nonfatal stroke. Cohorts that included African-American or White participants with at least 12 years of follow-up were included. Data from other race/ethnic groups were insufficient, precluding their inclusion in the final analyses”. The data they used was from “several large, racially and geographically diverse, modern NHLBI-sponsored cohort studies, including the ARIC study, Cardiovascular Health Study, and the CARDIA study, combined with applicable data from the Framingham Original and Offspring Study cohorts”. I think these were reasonable derivation cohorts to use. How did they validate the tool? Importantly they must use external testing because most models work in the cohort from which it was derived. They used “external cohorts consisting of Whites and African Americans from the Multi-Ethnic Study of Atherosclerosis (MESA) and the REasons for Geographic And Racial Differences in Stroke study (REGARDS). The MESA and REGARDS studies were approached for external validation due to their large size, contemporary nature, and comparability of end points. Both studies have less than 10 years of follow up. Validation using “most contemporary cohort” data also was conducted using ARIC visit 4, Framingham original cohort (cycle 22 or 23), and Framingham offspring cohort (cycles 5 or 6) data”. The results of their validity testing showed C statistics ranging from a low of 0.5564 (African -American men) to a high of 0.8182 (African-American women). The C statistic is a measure of discrimination (differentiating those with the outcome of interest from those without the outcome) and ranges from 0.5 (no discrimination- essentially as good as a coin flip) to 1.0 (perfect discrimination). The authors also found that it overpredicted events. See graph below.

graph of over prediction

So why don’t I want to use the new prediction tool? 3 main reasons:
1) It clearly over predicts outcomes. This would lead to more people being prescribed statins than likely need to be on statins (if you only use the tool to make this decision). One could argue that’s a good thing as statins are fairly low risk and lots of people die from heart disease so overtreating might be the way to err.
2) No study of statins used any prediction rules to enroll patients. They were enrolled based on LDL levels or comorbid diseases. Thus I don’t even need the rule to decide on whether or not to initiate a statin.
3) Its discrimination is not good….see the C-statistic results. For Black men its no better than a coin flip.